Editor’s Note: This is Redpoint VC Tomasz Tunguz’s third article in a series examining trends in the public and private technology markets. (Here are one and two.)
It is widely believed that the stock market is a leading health indicator for the venture industry. In reality, however, the performance of the SP 500 tells us very little about trends in the fundraising market.
For this week’s analysis, I evaluated correlating factors for VC fundraising and VC investment using annual data from the NVCA and Yahoo Finance from 2001 to 2011. I examined five possible correlating variables: number of IPOs, aggregate IPO value (proceeds from IPO), number of MA transactions, aggregate MA value and the performance of the SP 500 (year over year change). This analysis time shifts the data by one year.
The number of IPOs is the best predictive factor of VC dollars raised from limited partners
The number of IPOs in the preceding year is the best predictor of the venture fundraising market with a correlating coefficient of 0.77. In contrast, the performance of the SP is the poorest correlating factor of those considered with a coefficient of 0.38, implying venture fundraising is much more sensitive to the volume of IPOs than to increases public markets indices.
Aggregate IPO proceeds correlate fairly well with dollars raised, but given that Facebook’s IPO raised greater than 86% of IPO dollars so far in 2012, a potentially huge distortion of the data set, I suspect IPO proceeds will lose some of their predictive power next year.

The median number of venture backed IPOs over the past ten years is 40. In 2011, 45 venture backed companies went public indicating 2012 should be a relatively average year for venture fundraising. Looking toward 2013, the picture isn’t as clear. Through the first half of 2012, 30 venture backed companies have gone public, six fewer than the first half of 2011. And given the poor performance of many of them, 2012 venture backed IPO performance may fall below 10 year medians.

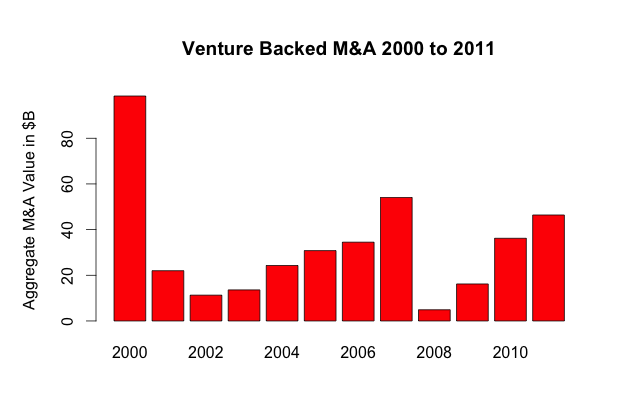
Aggregate MA Value is the best predictor of VC dollars invested
The total value of venture-backed MA is the best leading indicator of the number of dollars invested in a year also with a correlating coefficient of 0.77. Again, over the last 10 years the performance of the SP 500 is among the weakest correlations.

In 2011, venture backed MA reached $46.4B, about twice the level of the ten year trailing median of $24B, a good indicator for the health of the fund raising market in 2012. But venture backed MA proceeds in the first half of 2012 are 30% smaller than in 2011.
Outlook for 2012 and 2013
Although correlations do not prove causation, they can provide directional insight into the future health of venture markets. Assuming the 2012 trends of lower than average IPOs and MA hold, 2013 will be a weaker year for both venture fundraising and investment.
Sources:
Venture fund raising and investment data courtesy of the NVCA
Public market data provided by Yahoo finance